Drowning in Data: How Information Abundance Is Quietly Undermining Retail Investor Judgment
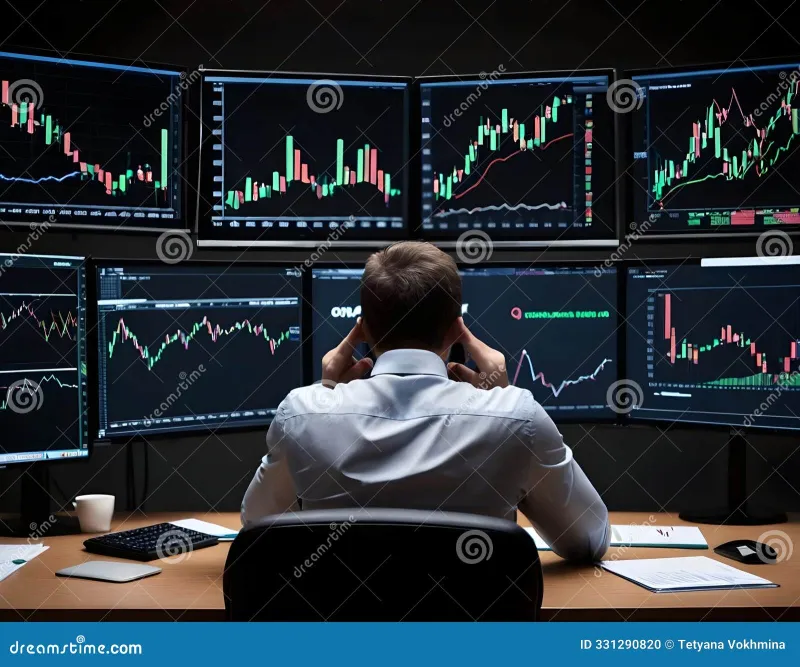
Photo: overwhelmed investor looking at multiple financial data screens charts, via thumbs.dreamstime.com
A generation ago, retail investors operated with a meaningful disadvantage: limited access to the kind of timely, granular market intelligence that institutional desks took for granted. Today, that gap has largely closed. Any individual with a brokerage account can pull up real-time quotes, Level II order book data, earnings call transcripts, options flow analytics, and AI-generated trade signals—often before their morning coffee is finished.
Yet despite this unprecedented democratization of financial information, retail trading outcomes have not improved commensurately. In fact, a growing body of behavioral finance research suggests that for a significant portion of individual investors, access to more data has made performance worse, not better. This is the precision paradox of modern investing: the tools designed to sharpen decision-making are, in many cases, dulling it.
The Architecture of Overload
To understand why information abundance becomes a liability, it helps to consider how the human brain processes complexity under conditions of uncertainty. Decision science has long established that beyond a certain threshold, additional information does not improve the quality of a choice—it degrades it. Psychologists call this phenomenon choice overload or, in trading contexts, analysis paralysis.
When a retail investor opens a modern trading platform, they are confronted with a cascade of competing signals: moving averages crossing on multiple timeframes, diverging momentum oscillators, conflicting analyst price targets, social media sentiment scores, and breaking macroeconomic headlines—all simultaneously. Each data point feels meaningful. Each seems to demand a response. The cognitive burden of synthesizing all of it in real time is enormous, and the brain responds predictably: it either freezes or defaults to the most emotionally salient input rather than the most analytically relevant one.
The result is a pattern that experienced advisors recognize immediately. Investors who once held positions with conviction begin second-guessing entries and exits based on whichever indicator they happened to check last. Portfolios that were built on sound, long-horizon theses get dismantled because a short-term chart pattern momentarily looked ominous. Discipline dissolves not from a lack of information, but from an excess of it.
The Timing Trap
One of the most measurable consequences of data overload is deteriorating trade timing. This might seem counterintuitive—shouldn't more real-time information produce better-timed decisions? In theory, yes. In practice, the opposite frequently occurs.
When investors have access to every tick of price movement, they tend to interpret noise as signal. A stock that dips 1.5% on a Tuesday afternoon becomes, through the lens of anxiety and abundant data, evidence of a deteriorating fundamental thesis. The investor sells. The stock recovers by Thursday. This cycle—observing meaningless short-term volatility, misattributing it to meaningful change, and acting on that misattribution—is one of the primary drivers of the well-documented gap between market returns and actual investor returns.
Research from firms tracking mutual fund and ETF flows consistently shows that retail investors tend to buy after periods of strong performance and sell after drawdowns, capturing less than the full return of the very instruments they own. Real-time data platforms, by making every fluctuation visible and emotionally immediate, accelerate this destructive behavior.
When More Tools Produce Less Clarity
The proliferation of advanced charting tools and algorithmic signal services has added another dimension to this problem. These tools are not inherently flawed—many are genuinely sophisticated. The issue lies in how retail investors deploy them.
A professional quantitative analyst using an algorithmic signal has a defined framework for interpreting that signal within a broader strategy. They understand its assumptions, its historical reliability across different market regimes, and its appropriate weighting relative to other inputs. A retail investor encountering the same signal typically lacks that context. They see a bullish crossover or a bearish divergence and treat it as a directive rather than one probabilistic input among many.
The consequence is a kind of false precision—a feeling of analytical rigor that is, in reality, just noise dressed up in technical language. Investors who would have been better served by a simple, rules-based allocation framework instead spend hours reconciling conflicting indicators, often arriving at decisions that are no better than a coin flip but feel far more justified.
A Framework for Signal Extraction
The solution is not to abandon data—it is to impose deliberate constraints on which data actually governs decisions. At ExBroker Group, we encourage clients to think of their information environment the way a skilled editor approaches a manuscript: ruthlessly cutting everything that does not serve the core purpose.
Here is a practical framework for doing exactly that:
Identify your decision-relevant data points. Before reviewing any market information, write down the three to five factors that are genuinely material to your investment thesis. For a long-term equity position, this might be revenue growth trajectory, free cash flow generation, and sector-level macro conditions. Everything else—daily price moves, short-term sentiment scores, Twitter chatter—should be treated as background noise until proven otherwise.
Establish a review cadence that matches your time horizon. If you are a long-term investor, reviewing your portfolio daily is almost certainly counterproductive. The data you encounter at that frequency is predominantly noise, and acting on it will cost you in both transaction costs and compounded timing errors. Weekly or monthly reviews, aligned with your actual investment horizon, reduce the surface area for bad decisions.
Create a pre-decision checklist. Before executing any trade, require yourself to answer a fixed set of questions: Has my original thesis changed? What is the evidence for that change? Am I reacting to a signal or to short-term volatility? This friction is intentional. It forces the deliberate, System 2 thinking that data overload tends to short-circuit.
Limit your platform exposure during market hours. This is perhaps the most counterintuitive recommendation, but the evidence supports it strongly. Investors who check prices less frequently make fewer impulsive trades and, over time, achieve better outcomes. Consider designating specific, limited windows for market review rather than maintaining a live feed throughout the trading day.
Precision Requires Subtraction
There is a certain irony in the fact that achieving precision in investing—genuine, outcome-improving precision—often requires removing data from the equation rather than adding it. The most disciplined investors are not those who consume the most information; they are those who have developed the clearest sense of which information actually matters for their specific objectives.
The financial services industry, including the platforms that deliver market data, has a commercial incentive to make investors feel that more information is always better. More data means more engagement, more trades, and more revenue. Retail investors have no such incentive. Their interest lies in making fewer, higher-quality decisions—and that requires the discipline to tune out the noise that an information-rich environment relentlessly produces.
At ExBroker Group, our guidance to clients is straightforward: define your edge, identify the data that supports it, and treat everything else as distraction. In a market environment where everyone has access to the same firehose of information, the investors who win are not those who drink deepest—they are those who know exactly when to step back.